Nutritional Biomarkers Explained: Your 2026 Health Guide
- Alvi Moreno
- 4 days ago
- 8 min read


TL;DR:
Nutritional biomarkers are objective measures in blood, urine, or tissue that reflect actual nutrient absorption and metabolism. They surpass dietary surveys by detecting deficiencies early and guiding personalized health interventions through detailed panel analysis and tracking tools like Bimiapp. Regular testing and understanding nutrient interactions are essential for proactive health management and optimal nutrient status.
Nutritional biomarkers are measurable substances in blood, urine, or tissue that objectively reflect your nutritional status and dietary intake. Unlike a food diary or a 24-hour recall survey, these biological markers show what your body has actually absorbed and metabolized. The 2026 CDC Nutrition Biomarkers Report tracks 131 distinct nutritional biomarkers, from vitamin status to metabolic indices. That scope alone signals how far the science has moved beyond asking people what they ate for lunch. Tools like Bimiapp are built around this shift, helping you monitor over 60 nutrients and translate raw data into decisions you can act on.
What are nutritional biomarkers and how do they work?

Nutritional biomarkers are biological indicators measured in samples like blood serum, urine, or red blood cells. They tell you whether a nutrient is present in your body at functional levels, not just whether you consumed it. This distinction matters because absorption, metabolism, and individual genetics all affect how much of any given nutrient your body actually uses.
Self-reported dietary surveys are the traditional standard, but they carry well-documented reliability problems. People underreport calories, misremember portion sizes, and overlook fortified foods. The field is moving away from self-reporting toward objective biomarker integration that enables earlier disease risk detection and personalized intervention. That shift is not a trend. It is a correction.
Biomarkers also capture what surveys cannot: the downstream effects of nutrient metabolism. Homocysteine, for example, rises when B vitamins are functionally low, even if your reported intake looks adequate. That kind of signal is invisible to a food log and visible only through lab testing.
What are the different types of nutritional biomarkers?
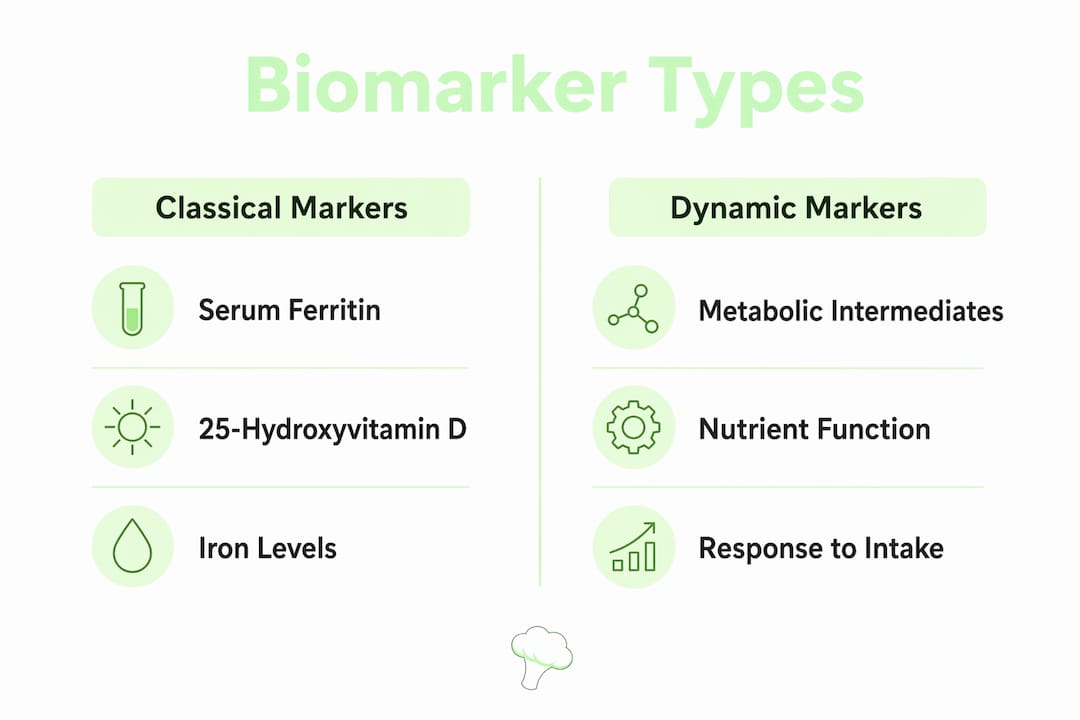
Nutritional biomarkers fall into two primary categories, and understanding both is the foundation of any serious assessment.
Classical micronutrient markers directly measure the concentration of a specific vitamin or mineral in your blood or tissue. Common examples include:
25-hydroxyvitamin D for vitamin D status
Serum ferritin for iron storage
Serum zinc and selenium for trace mineral status
Plasma retinol for vitamin A
Red blood cell folate for long-term folate status
These markers are straightforward. A low serum ferritin reading means your iron stores are depleted. A low 25-hydroxyvitamin D reading means your body lacks the active form of the vitamin.
Dynamic metabolic biomarkers are more complex. They reflect how your body is functioning in response to its nutritional environment. Examples include inflammatory cytokines like C-reactive protein (CRP), gut microbiota metabolites such as short-chain fatty acids, and functional indices like homocysteine and methylmalonic acid. According to research on physiological regulation of biomarkers, these markers are both descriptive and mechanistic, reflecting dynamic physiological processes influenced by diet, microbiota, and systemic inflammation.
The two categories complement each other. A classical marker tells you what is present. A dynamic marker tells you what is happening because of it.
Pro Tip: If your vitamin D serum level looks borderline normal but your magnesium is low, your body may not be converting vitamin D to its active form efficiently. Always check both together.
How are nutritional biomarkers measured?
Clinical measurement of nutritional biomarkers follows a structured process. The biological sample type determines which markers you can assess and how accurately.
Blood serum or plasma is the most common sample. It measures circulating levels of vitamins A, D, E, K, B12, folate, iron, zinc, selenium, and inflammatory markers like CRP and homocysteine.
Red blood cells (RBCs) provide a longer-term picture. RBC folate and RBC magnesium reflect status over the prior 2–3 months, not just recent intake.
Urine samples measure water-soluble vitamins and their metabolites. Methylmalonic acid in urine is a reliable functional indicator of B12 status, often more accurate than serum B12 alone.
White blood cells are used in specialized intracellular testing, which measures nutrient concentrations inside cells rather than in the bloodstream.
Intracellular nutrient concentrations and specific metabolic intermediates are more accurate indicators of functional nutrient status than serum levels alone. Standard blood panels capture only a fraction of the full picture.
The table below shows the difference between standard and advanced panels:
Panel Type | Markers Covered | Best Used For |
Basic panel | 5–10 core markers (D, B12, iron, folate) | Annual checkups, initial screening |
Standard panel | 30–60 markers including B-vitamins, minerals | Identifying common deficiencies |
Advanced panel | 60–130 markers including amino acids, fatty acids, antioxidants | Precision nutrition, chronic condition management |
Comprehensive nutritional panels cover B-vitamins (B1 through B12), fat-soluble vitamins (A, D, E, K), minerals like magnesium, zinc, selenium, and iron, plus functional markers like homocysteine. Advanced panels go further, adding amino acid profiles, omega-3 fatty acid indices, and antioxidant capacity measures.
Why are nutritional biomarkers important for your health?
The importance of nutritional biomarkers becomes clear when you consider how often standard dietary assessments miss real problems. A person eating a varied diet can still have a functional vitamin B12 deficiency if their intrinsic factor production is impaired. A person taking a daily multivitamin may still show low intracellular magnesium because their supplement form is poorly absorbed.
Biomarkers close that gap. They show what is actually happening inside your body, not what should be happening based on your food log. The benefits of assessing nutritional biomarkers include:
Early deficiency detection before symptoms appear, such as catching low ferritin before fatigue sets in
Supplement effectiveness monitoring by comparing your levels before and after a protocol
Risk stratification for conditions linked to nutritional status, including cardiovascular disease, osteoporosis, and metabolic syndrome
Personalized dietary adjustment based on your actual absorption and metabolism, not population averages
CDC biomarker data shows that biomarker variability and supplementation effects are far clearer through lab testing than through intake data alone. That means you can actually measure whether your supplement is working, not just assume it is.
Bimiapp supports this process directly. The platform tracks over 60 nutrients and generates personalized recommendations based on your age, weight, BMI, and activity level. When you log meals through Bimiapp’s AI photo recognition feature, you build a dietary record that you can compare against your biomarker results over time. That combination of intake data and nutrient tracking is where real personalized health optimization begins.
Pro Tip: Test your baseline biomarkers before starting any new supplement protocol. Without a starting point, you cannot measure progress or identify what is actually working.
How do nutritional biomarkers interact with each other?
Single-marker results are useful but incomplete. Nutrient metabolism is a network, not a series of isolated reactions. Interpreting one marker without context from related markers leads to missed diagnoses and poor dietary decisions.
The table below shows key nutrient interactions that affect how you should read biomarker results:
Primary Marker | Interacting Nutrient | Why It Matters |
Vitamin D (25-OH) | Magnesium | Magnesium is required to convert vitamin D to its active form |
Serum B12 | Methylmalonic acid | Normal B12 serum can still show functional deficiency via elevated MMA |
Iron (ferritin) | Vitamin C | Vitamin C enhances non-heme iron absorption; low C impairs iron status |
Omega-3 index | CRP (inflammation) | Low omega-3 correlates with elevated systemic inflammation markers |
Folate | Homocysteine | Low folate raises homocysteine, a cardiovascular risk marker |
Relying on single biomarkers is misleading. Nutrient pathways are interconnected, and experts emphasize functional multiplex biomarker interpretation over isolated values. A normal serum B12 reading, for instance, does not rule out a functional B12 deficiency if methylmalonic acid is elevated.
Longitudinal tracking adds another layer of value. A single test gives you a snapshot. Monthly or quarterly tracking through a tool like Bimiapp gives you a trend line. That trend line tells you whether your diet and supplement adjustments are actually moving your markers in the right direction. You can review your nutritional deficiency patterns over time and catch problems before they become symptoms.
Establishing a personalized baseline biomarker profile supports objective dietary monitoring and enables timely adjustments before clinical symptoms or deficiencies emerge. That is the practical case for testing proactively, not just when something feels wrong.
Key takeaways
Nutritional biomarkers provide objective, measurable evidence of your nutrient status that no food diary or dietary survey can replicate.
Point | Details |
Biomarkers beat self-reports | Blood and urine markers reflect actual absorption and metabolism, not just what you ate. |
Two core categories exist | Classical micronutrient markers measure levels; dynamic metabolic markers measure function. |
Panel depth matters | Advanced panels covering 60–130 markers reveal deficiencies that basic tests miss entirely. |
Nutrient interactions are critical | A single normal result can hide a functional deficiency when related markers are not checked. |
Longitudinal tracking drives results | Repeated testing over time shows whether your diet and supplement changes are actually working. |
Why i think most people test too late
The most common mistake I see is waiting for symptoms before ordering a biomarker panel. By the time fatigue, brain fog, or muscle weakness appears, a deficiency has usually been developing for months. Serum ferritin can drop for a year before you feel it. Vitamin D insufficiency can persist through two winters before it shows up as anything noticeable.
The second mistake is treating a single test as a verdict. I have reviewed panels where every individual marker fell within the reference range, yet the pattern across homocysteine, methylmalonic acid, and RBC folate told a clear story of functional B-vitamin insufficiency. Reference ranges are population averages. They are not your personal optimal.
What actually works is establishing a baseline while you feel healthy, then tracking changes as you adjust your diet and supplementation. Bimiapp makes this practical by connecting your daily food intake data with your nutrient targets, so you can see whether your meals are consistently supporting or undermining your biomarker goals. The micronutrient guide on Bimiapp is a good starting point for understanding which nutrients to prioritize before your first panel.
The field is moving toward multi-biomarker precision nutrition, and the tools to participate in that shift are available to anyone willing to test proactively. Start before you have a reason to worry.
— Alvi
Track your nutrients with Bimiapp
Understanding your biomarker results is only half the work. The other half is knowing what to eat to move those numbers in the right direction.

Bimiapp monitors over 60 nutrients, including amino acids, vitamins, minerals, and fatty acids, and generates personalized recommendations based on your individual metrics. The AI photo recognition feature lets you log meals in seconds, and the Meals Vault stores your data so you can spot trends over time. See how Bimiapp works and start building the dietary record that makes your next biomarker panel actually useful. You can also explore Bimiapp’s full nutrition tracking tools to get a complete picture of your daily intake.
FAQ
What exactly are nutritional biomarkers?
Nutritional biomarkers are measurable substances in blood, urine, or tissue that reflect your body’s nutritional status and dietary intake. They include direct nutrient measures like serum ferritin and 25-hydroxyvitamin D, as well as functional markers like homocysteine.
How are nutritional biomarkers different from a standard blood test?
A standard blood test typically covers 5–10 core markers. A comprehensive nutritional biomarker panel covers 60–130 markers, including intracellular nutrient levels, amino acid profiles, and inflammatory indices that standard tests do not assess.
Can my biomarkers look normal but still indicate a deficiency?
Yes. Serum B12 can fall within the normal range while methylmalonic acid remains elevated, indicating a functional B12 deficiency at the cellular level. Single-marker normalcy can mask underlying deficits when related markers are not reviewed together.
How often should i test my nutritional biomarkers?
Experts recommend establishing a baseline while healthy, then retesting every 3–6 months when actively adjusting diet or supplementation. Annual testing is the minimum for ongoing health maintenance.
How does Bimiapp help with nutritional biomarker tracking?
Bimiapp tracks over 60 nutrients daily and provides personalized recommendations based on your age, weight, BMI, and activity level. Logging meals through Bimiapp builds a dietary record you can compare against your lab results to identify gaps and measure progress.
Recommended
Comments